Team Dashboard — Group Usage Analysis
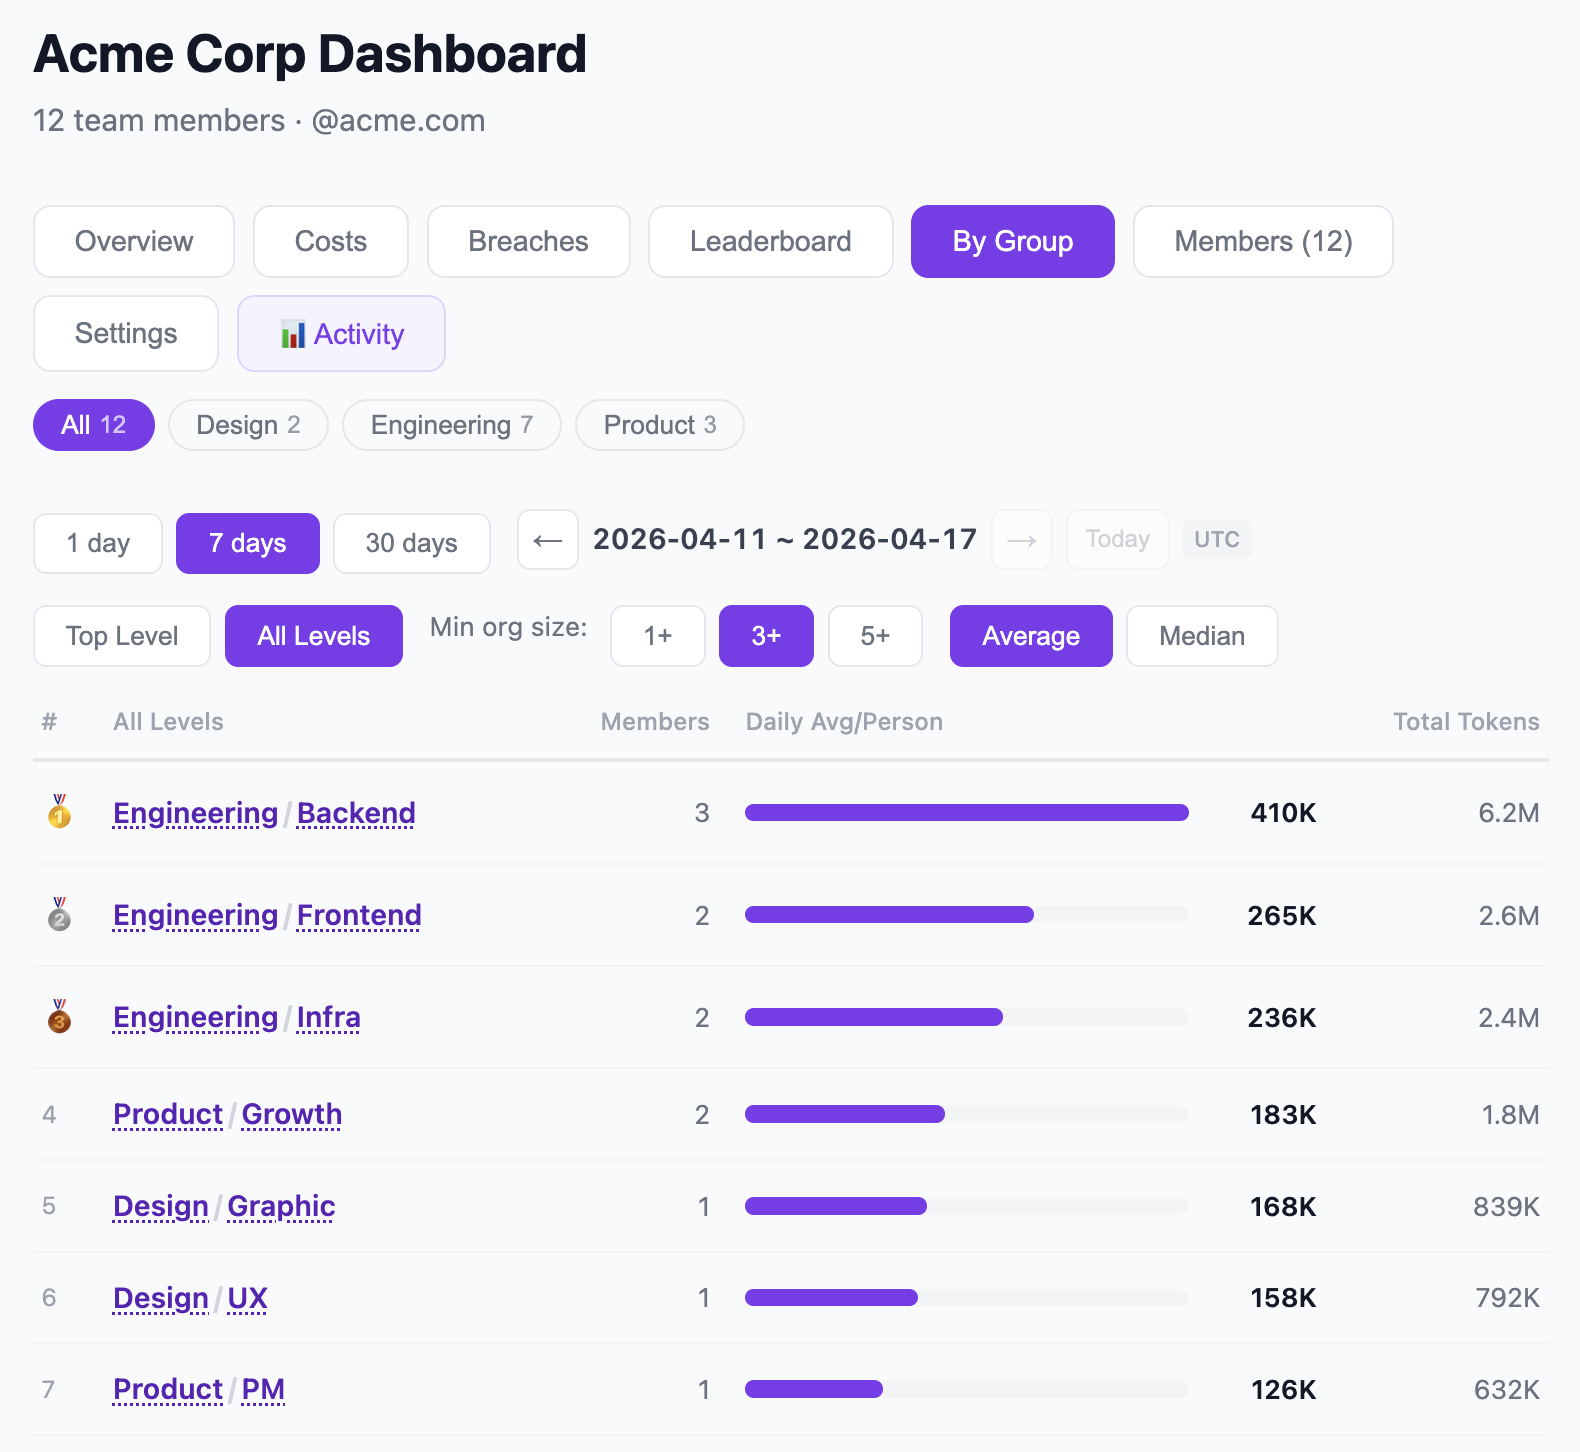
A new Group tab has been added to the Team Dashboard.
Compare Claude usage across teams and departments in your organization at a glance.
Key features
- Period selection (1d / 7d / 30d) with date navigation
- Toggle between top-level and sub-organization views
- Minimum member filter (1+ / 3+ / 5+)
- Average / median statistics toggle
- Click a group to jump to the filtered leaderboard
Setup
Assign the "Group" for each member in the Settings tab to activate group analysis. Use / for hierarchy (e.g., Engineering/Backend, Engineering/Frontend).
Check out in demo page.
https://claudetuner.com/dashboard/team/?demo=true&tab=group&grp_level=1