Service Speed Improvements & Stabilization
Hello, this is Claude Tuner.
In early June, with the addition of simultaneous Gemini · ChatGPT usage collection (details), the volume of collected data grew significantly. This caused a sharp spike in database write load and slowed the service overall. We're sorry for the inconvenience.
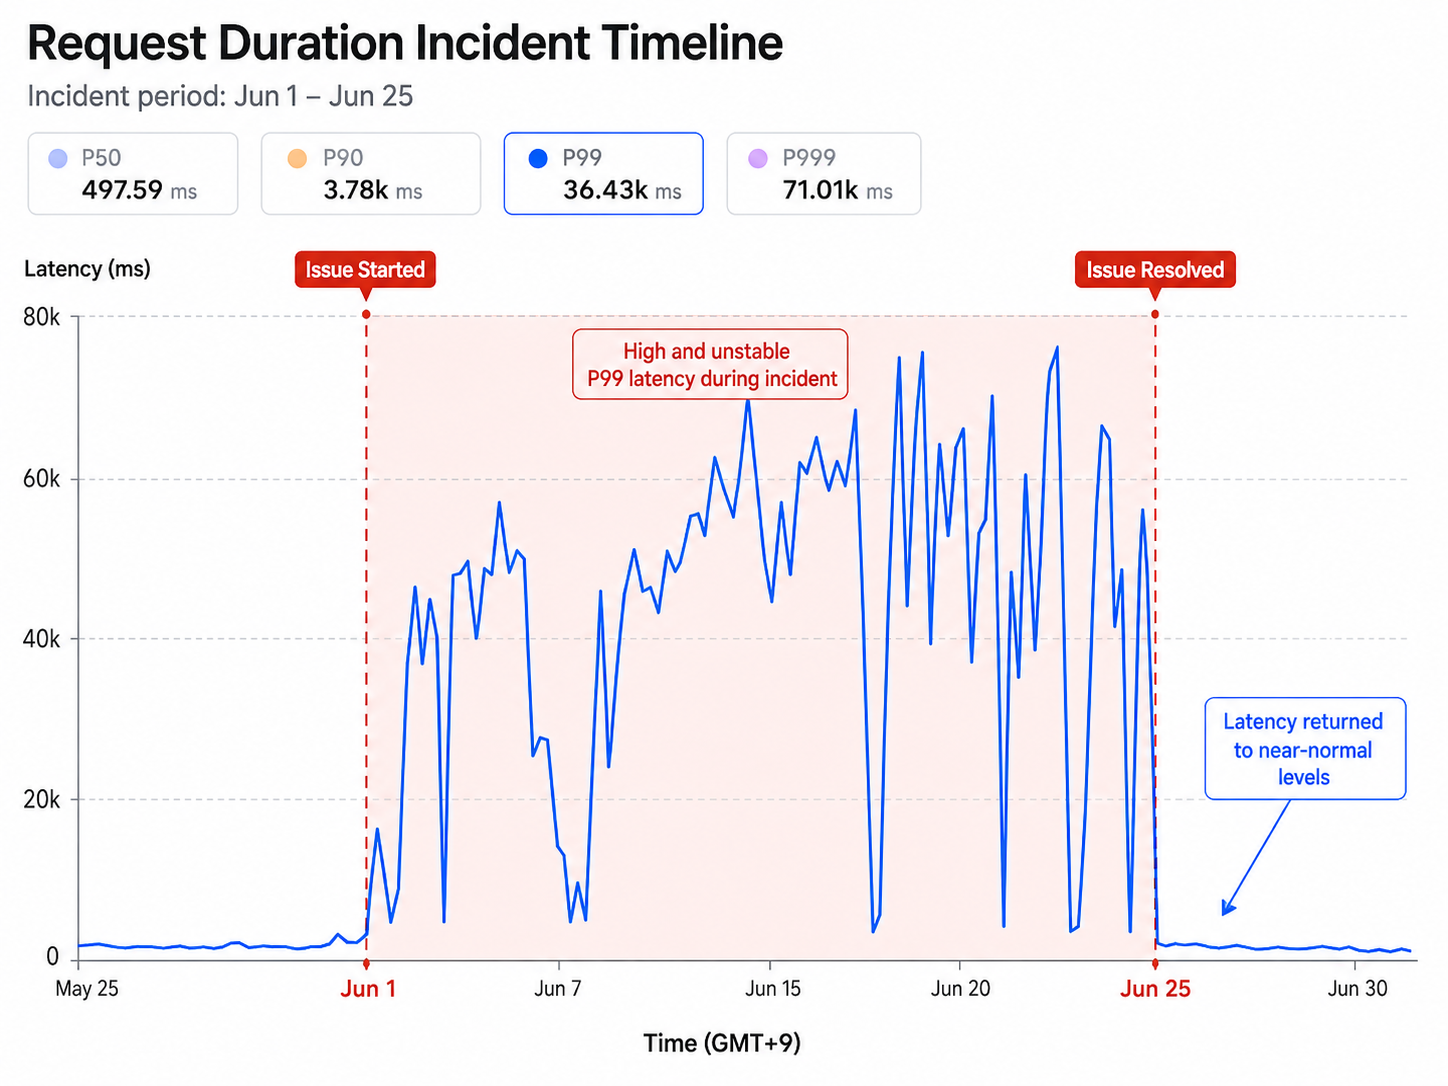
During this period, you may have experienced:
- Delays before usage sent by the extension appeared on the dashboard
- Dashboard menus loading very slowly
- The dashboard failing to load entirely
The cause wasn't simply user growth, but that our existing database (Cloudflare D1) and its single-writer architecture couldn't keep up with the increased collection volume. It was a tricky problem, so we went through several attempts and rounds of validation:
Approaches we tried that hit limits
- Reducing collection volume — We switched from collecting every 10 minutes unconditionally to collecting only when usage actually changes. This cut load but wasn't a fundamental fix.
- Splitting the database — We moved collection records to a separate database, but the same single-writer limit followed and it slowed down again at peak hours. "Just adding another database" didn't solve it.
- We also tried making some writes asynchronous and adjusting server location, but the effect was limited.
Approaches that worked
- Reworking the collection pipeline — We split collected data into a dedicated queue and pinned the server's execution region to the same region (Asia) as the user backend, greatly reducing latency.
- Migrating to a dedicated time-series database — Ultimately we moved usage records to an external time-series database (Timescale) with no single-writer limit, fundamentally fixing things so reads and writes no longer block each other. Migrating carefully step by step — so no data was lost or distorted — took some time.
As a result, the service stabilized as of the morning of June 25 (KST). Worst-case latency (P99), which had reached tens of seconds, dropped to a few hundred milliseconds, and average response time (P50) improved from roughly 1 second to around 100 milliseconds. The reflection delays, slow loading, and load failures above have also been resolved — usage now appears almost in real time and the dashboard opens quickly.
That said, some server and database improvements still remain, so you may see occasional instability. If you run into any issues, please send us a report via Contact and we'll respond quickly.
The new architecture is built to stably support far more users than today. Thank you for your patience through this process — we'll keep working toward a faster, more stable service.